Made for the top-down view
Trained on 360° fisheye images taken from the ceiling, where people appear as heads and shoulders instead of full bodies.

Occupancy Monitoring System is an AI computer vision system for smart offices. Ceiling-mounted 360° fisheye cameras detect people by their heads with a head detection model that PANTONA built and trained in-house, map each detection to a chair or area on the floor plan, and turn it into real-time and historical occupancy data: key performance indicators (KPIs), charts, heatmaps, and reports for facility and real estate teams.
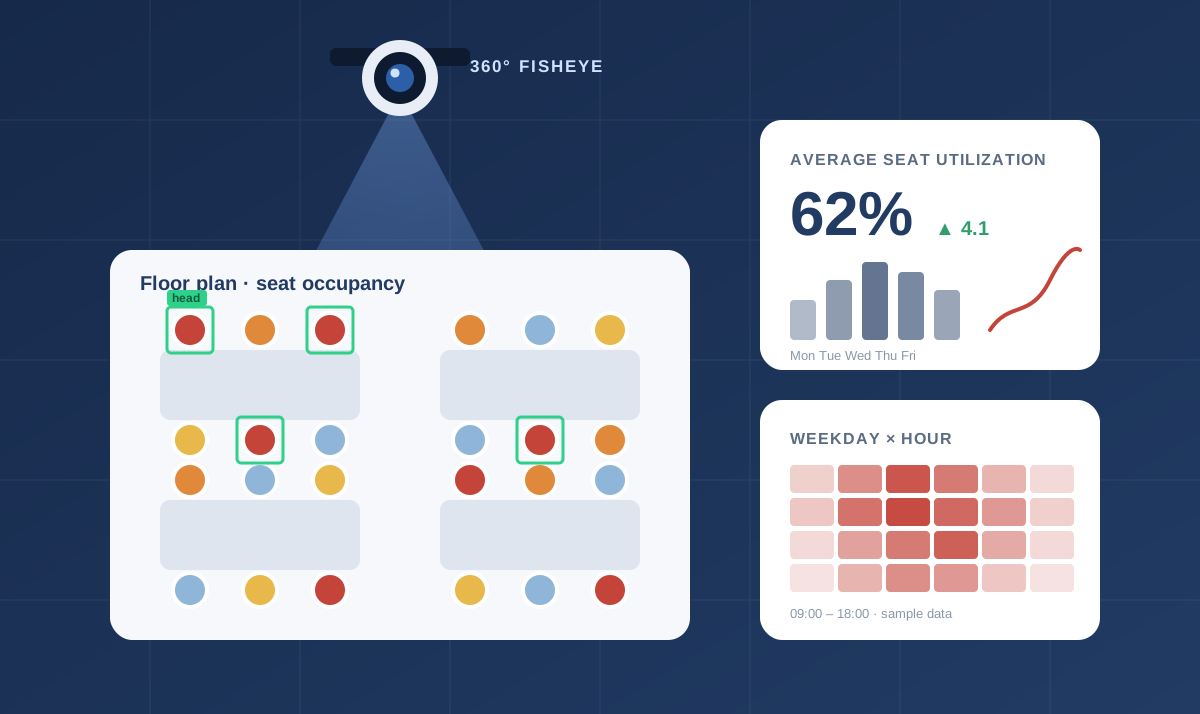
The head detection model behind Occupancy Monitoring System was built and trained by PANTONA’s own engineers. Ceiling-mounted fisheye cameras see people from directly above, an angle that general-purpose person detectors are not designed for, so we trained a model that recognizes heads from that top-down view.
Trained on 360° fisheye images taken from the ceiling, where people appear as heads and shoulders instead of full bodies.
Uses the YOLO architecture (YOLOv9) as its base, with PANTONA’s own training and tuning for seats and areas.
Because the model is ours, we can retrain and update it for new offices, layouts, and camera positions.
Add fisheye CCTV cameras as video sources and save camera presets for each view.
Draw chairs, areas, and room boundaries on the camera view and an interactive floor layout.
PANTONA’s own YOLO-based head detection model finds heads and matches them to chairs or areas, on a schedule or on demand.
Occupancy rate, total visitors, and maximum chairs used, by date, month, hour, or weekday.
Send real-time availability to room management systems such as RoomSense, and to the dashboard.
CSV and ZIP export, holiday and working-hour settings, logs, and module updates.
Detects heads with fisheye cameras and maps them to chair locations to track real-time and historical chair use.
Measures how often user-defined areas are used, with occupancy rate, visitor count, people density, and averages.
KPI cards, trends, floor-plan heatmaps, seat rankings, and peak-hour analysis from data already in the main dashboard.
The same seat occupancy analytics as a stand-alone application for sites without the cloud dashboard.
Register a 360° fisheye camera as a video source and restart the application.
Save camera positions and angles for each monitoring view.
Draw chair and area shapes, group them, and place them on the room layout.
Run detection by scheduler or manually, then read the statistics, heatmaps, and dashboard.
The dashboard summarizes the selected period and space in five KPI cards, then lets users drill down by day, weekday, hour, seat, and floor.
PANTONA’s QA team tests every component against detailed checksheets in Chrome and Edge, covering UI, validation, localization, features, scenarios, and statistics validation.
| Component | Test items | Passed | Pass rate | Coverage |
|---|---|---|---|---|
| Seat Monitoring | 703 | 703 | 100% | Login, settings, mapping, API, statistics, statistics validation, viewer, maintenance |
| Area Monitoring | 439 | 439 | 100% | Login, admin, area mapping, statistics, statistics validation, viewer, maintenance |
| Dashboard Cloud | 158 | 158 | 100% | UI/UX, validation, localization, features, scenarios, rare cases, security, performance |
| Dashboard Stand-alone | 121 | 121 | 100% | UI/UX, validation, localization, log evidence, features, scenarios, rare cases |
| Total | 1,421 | 1,421 | 100% |
Full access: mapping, presets, maintenance, updates, holidays, and all statistics. One active session at a time.
Read-only access to the viewer and statistics. Multiple logins allowed.
Public viewer mode that shows live occupancy without changing settings.
Tell us about your office, floors, and cameras, and we’ll share more details.