
Acoustic simulation
for sound barriers.
Noise App is a web-based acoustic simulation tool. Place noise sources, sound barriers, and receivers on a site plan or satellite map, and see how sound travels in a real-time heatmap. Engineers, planners, and environmental teams use it to design sound barriers and check noise levels before anything is built.
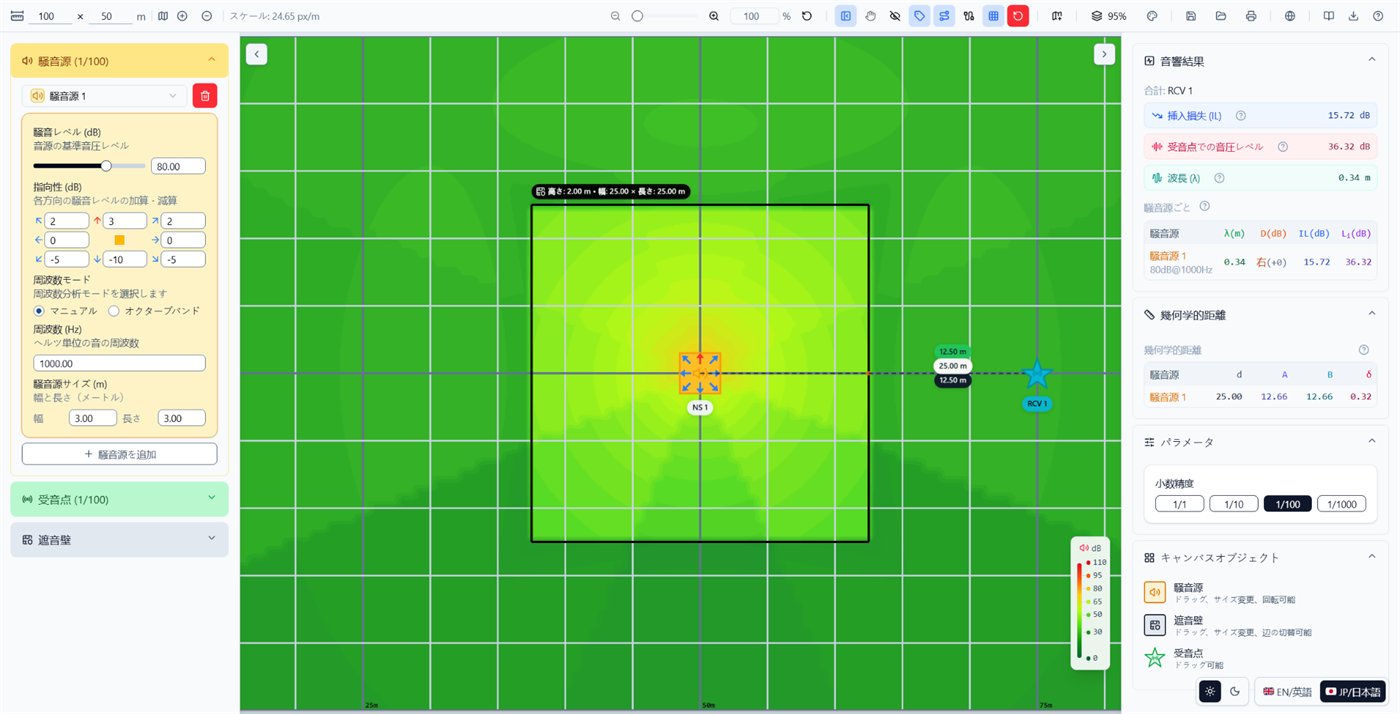
How it works.
Place noise sources
Set the level in dB, the frequency, the size, and how loud each direction is.
Add a sound barrier
Draw the wall as a box or any polygon, set its height, and open or close each side.
Add receivers
Put measurement points where people live or work, with their background noise.
Read the results
Follow the heatmap and read insertion loss and the level at each receiver in real time.
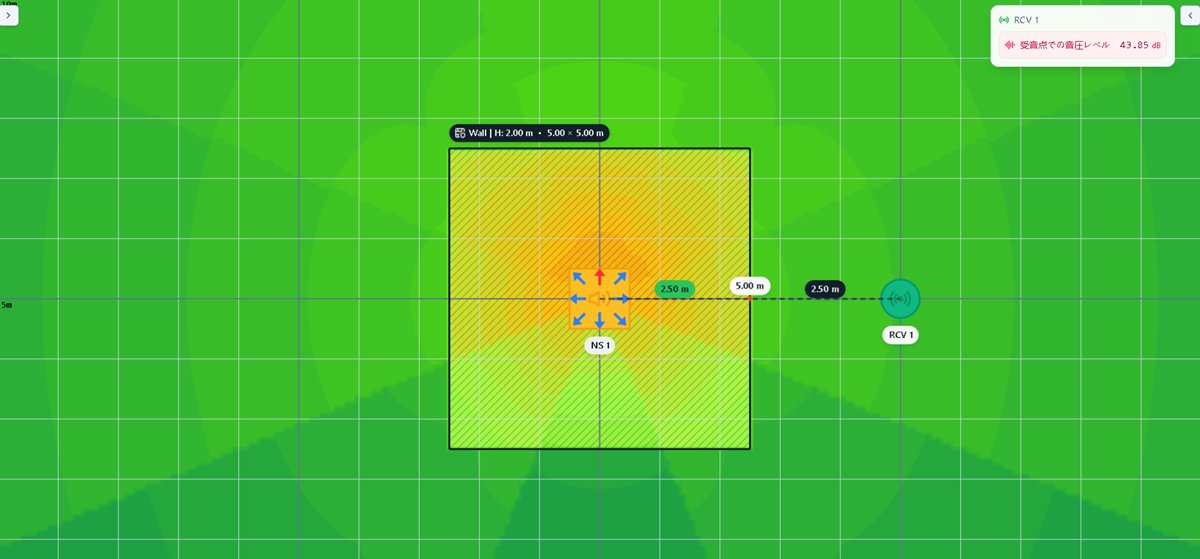
Real-time heatmap.
Every change redraws the heatmap at once. Color thresholds are fully adjustable, so the map can follow the regulation or internal policy your project must meet.
- Custom dB thresholds and colors (up to 10)
- A noise safety standards tab, for rules such as OSHA and NIOSH
- Distance and height labels on the canvas
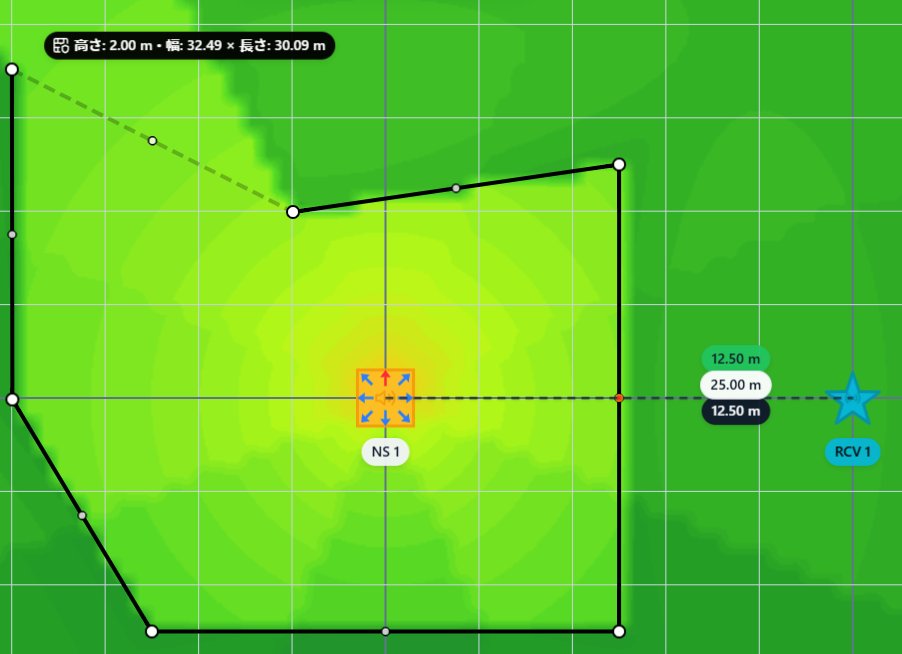
Polygon barriers.
Barriers are no longer limited to rectangles. Add corner points to build L-shaped, U-shaped, or free-form walls, and leave any side open where the site needs access.
- Free-form polygon walls
- Open or closed status for each side
- Bounding box and dimensions update live
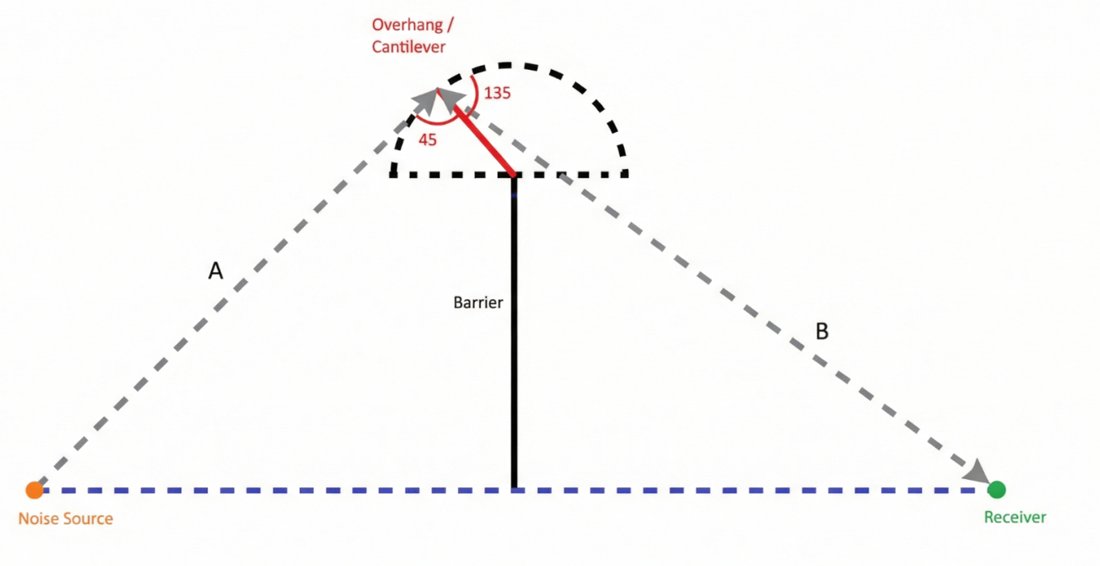
Calculation model.
Calculations follow the real path of sound over the barrier, including overhangs on top of the wall. Choose the Maekawa method for pure diffraction, or enter the transmission loss from a material datasheet.
- 3D distances with overhang and cantilever
- Maekawa formula or manual transmission loss
- Decimal precision from 1 to 1/1000
Octave band analysis.
Real noise is never a single tone. Octave band mode calculates wavelength, Fresnel number, insertion loss, and the final level for each of ten standard bands (IEC 61260-1, ISO 266), then highlights the dominant frequency to target.
Barrier panel estimator.
Enter the size of one standard panel, and Noise App calculates the area of every active side and how many panels to buy. Open sides are left out automatically.
Changes from v3.0 to v4.0.
| v3.0 | v4.0 | |
|---|---|---|
| Heatmap colors | Fixed thresholds | Custom thresholds for any regulation |
| Frequency | One frequency at a time | Ten octave bands with the dominant band |
| Barrier shape | Rectangle only | Any polygon, open or closed sides |
| Materials | Calculated by hand | Built-in panel estimator |
| Input precision | Whole numbers in some fields | Decimals everywhere, adjustable precision |
| Calculation method | Maekawa when TL is 0 | Toggle: Maekawa or manual transmission loss |
Calculation methods.
Every result can be traced back to a standard formula, documented in the user guide and checked against a separate calculation sheet.
- Wavelength: λ = c / f
- Fresnel number: N = 2δ / λ
- Insertion loss with the Maekawa method
- Distance decay of sound pressure
- Logarithmic sum of multiple sources
- Background noise at the receiver
- 3D path length over the barrier
- Octave bands per IEC 61260-1 and ISO 266
Comparison with field measurements.
Simulation results were compared with on-site measurements of a real sound barrier, with and without the wall, and the barrier settings were tuned with a transmission loss adjustment.
And more
Test coverage.
PANTONA’s QA team tests every release with a bilingual check sheet in Chrome and Edge, including calculation accuracy, edge cases, negative tests, and localization.
System requirements.
Planning a sound barrier?
Tell us about your site and noise source, and we’ll show you how Noise App can help.